Overview
Business Process Support Overview
Objective: The goal of this course is to introduce students to various tools, techniques, and technologies used to acquire data and process it into meaningful information that can support business functions and processes.
Learning Outcomes: By the end of this course, students should be able to:
- Discuss the use of data and information to support business processes and understand their value for an organization.
- Understand the implications of using data and information to support business processes in real-world scenarios.
- Explore the tools and technologies associated with data science and how they support business processes.
- Demonstrate the use of data science techniques to make recommendations for solving real-world business problems.
Practical Application:
Throughout the course, we will explore real-world business problems and the emergence of data science. We will also demonstrate the practical application of data science techniques to support these business processes.
Key Topics:
-
Data Warehousing:
- This is a technique for collecting and managing data from varied sources to provide meaningful business insights. Think of it as a large storage system where all the data from different sources is kept in an organized manner.
-
Business Intelligence:
- This is a technology-driven process for analyzing data and presenting actionable information. It helps executives, managers, and other corporate end users make informed business decisions. Imagine it as a smart assistant that helps you understand complex data and make decisions based on it.
-
Data Mining:
- This involves discovering patterns in large data sets using methods from machine learning, statistics, and database systems. It's like finding hidden treasures in a vast sea of data.
-
Data Science:
- This field involves extracting information and knowledge from data using various scientific methods, algorithms, and processes. It's the art and science of turning raw data into valuable insights.

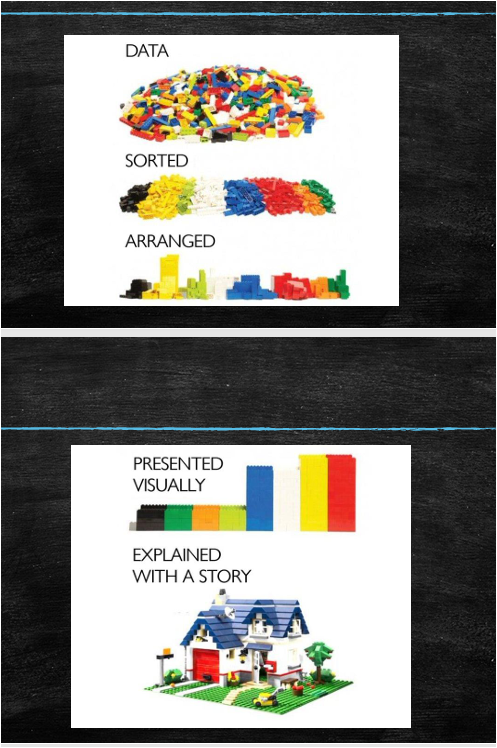
This image uses LEGO bricks as an analogy to explain the process of turning raw data into meaningful insights or stories: DATA (Raw State) The pile of unsorted LEGO bricks represents raw, unprocessed data. It is disorganized and lacks any clear structure or meaning.
SORTED The bricks are now grouped by color, symbolizing the first step in data processing—organizing and categorizing the raw data.
ARRANGED The bricks are stacked and structured, representing further refinement and analysis. This step involves arranging the data in a way that highlights patterns or relationships.
PRESENTED VISUALLY The stacked bricks are arranged into bar-like structures, mimicking a bar chart. This step shows the importance of visualizing the data to make it more comprehensible.
EXPLAINED WITH A STORY Finally, the LEGO pieces are assembled into a house, representing the creation of a meaningful narrative or story. This is the ultimate goal: transforming data into actionable insights or a compelling explanation
Example: Retail Store Inventory Management
Imagine you are managing a retail store, and you want to optimize your inventory management to ensure you have the right products in stock at the right time. Here's how the concepts from the course can be applied:
-
Data Warehousing:
- You collect data from various sources such as sales transactions, supplier deliveries, and customer feedback. This data is stored in a data warehouse, which acts as a central repository. For example, you might have data on how many units of a particular product were sold each day, how many were delivered by suppliers, and customer reviews about the product.
-
Business Intelligence:
- Using business intelligence tools, you analyze the data from the data warehouse to gain insights. For instance, you might create reports and dashboards that show sales trends, inventory levels, and customer preferences. This helps you make informed decisions about which products to stock up on and which ones to reduce.
-
Data Mining:
- You apply data mining techniques to discover patterns in your sales data. For example, you might find that certain products sell better during specific seasons or that customers who buy one product are likely to buy another related product. This information can help you plan promotions and optimize your inventory.
-
Data Science:
- You use data science methods to build predictive models. For instance, you might develop a model that predicts future sales based on historical data, current trends, and external factors like holidays or economic conditions. This allows you to forecast demand and adjust your inventory levels accordingly.
Practical Application:
Let's say you notice that sales of winter coats increase significantly in November and December. By analyzing past sales data (data warehousing) and creating visual reports (business intelligence), you identify this trend. Using data mining, you discover that customers who buy winter coats also tend to buy scarves and gloves. With data science, you build a predictive model that forecasts a 20% increase in winter coat sales for the upcoming season.
Based on these insights, you decide to:
- Increase your inventory of winter coats, scarves, and gloves in October.
- Run a promotion offering discounts on scarves and gloves with the purchase of a winter coat.
- Monitor sales data in real-time to adjust your inventory and promotions as needed.
By applying these techniques, you ensure that your store is well-stocked with the right products, improve customer satisfaction, and increase sales.